We've added a Slideshare Presentation of the information at the bottom of the post.
1. Mapping is not a one-time job.
Really, it isn't. This may seem like a strange #1 commandment, but we wanted to make it clear from the outset: you will have to map your environment more than once. If continuous monitoring is not required by a regulatory agency in your application, then we suggest mapping until all problem spots (see Law #5) have been addressed.
2. Remember that hot air rises.
Simple enough, right? This commandment speaks to the issue of companies only monitoring at the ground level, yet stacking temperature and humidity sensitive products on shelves tens of feet up in the air. In (almost) every warehouse, clean room, storage room, or production facility, you should map on more than one vertical plane, because temperatures stratify.
3. Note the location of HVAC outputs, and then place a temperature monitor near those outputs.
HVAC outputs are obviously critical to maintaining a consistent temperature in a temperature controlled environment. We recommend continuously monitoring these outputs, and in the case of temperature mapping, paying close attention to any abnormal fluctuations in temperature.
4. Place your loggers in problem spots.
Problem spots in your environment include, but are not limited to, the following:
- Ceilings
- Exterior Walls
- Heaters
- Pallet Storage areas
- HVAC outputs
- Exits to uncontrolled spaces
- Ground and off-ground mezzanines
5. Know how much distance you should put between loggers.
Sound vague? That's temperature mapping for you. Because the size and layouts of warehouses and other environments vary, the distance between your data loggers will be unique to your location. As a good rule of thumb, you should monitor on both three horizontal planes (left, middle, right) and three vertical planes (bottom, middle, top) for a total of 27 points. This model however, does not include problem spots, and does not account for larger environments, where temperatures will stratify immensely. In other words, 27 points for a 500 square foot warehouse may be adequate, but not for a 50,000 square foot warehouse.
The goal of temperature mapping is to get an accurate representation of what the various temperatures in your warehouse actually are, so that the values you record are useful to you in your application, and you comply to regulatory agencies (such as the FDA). Finding that "happy middle" in regards to the location of your temperature monitors is a difficult but integral part of temperature mapping.
6. Note your critical product storage areas.
In many instances, warehouses don't just hold one product. For example, let's say you own a warehouse that stores chocolate and paper. You probably want to place more loggers around the chocolate, seeing as how it could melt. It's usually not this simple (and the warehouse probably stores more comparable items), but you should be cognizant of areas that store products that will deteriorate, or even become dangerous, if they are exposed to extreme temperatures.
7. Label all data loggers and record their location.
Don't just put all your loggers out in your environment silly. Place labels on each one, noting the location of the logger, and the date it was put out in your environment. Then, record the date and location of each logger on a spreadsheet, giving each logger a number and name (we suggest naming it after it's location, like "Office door logger"). Then, when you remove the data of each logger, you will know where each logger was placed, and where to return it to.
Note: Wireless monitoring systems like DicksonOne make this process much, much easier.
8. Pick the proper sampling rate.
Just like the amount of distance between loggers, the proper sample rate for temperature mapping is also a delicate science. In 2011, we published a blog post related to temperature mapping, and offered some guidance on the issue, arguing that sampling every minute would provide an overwhelming (and thus hard to work with) amount of data, and sampling every fifteen minutes provided a much more manageable amount of data to work with. Times have changed, and while an overload of data is still something to be concerned about, the rise of wireless data monitoring options, and automatic mean kinetic temperature calculators, allows some manufacturing supervisors or quality control agents the ability to sample more often.
However, sampling rate hinges on the device you are using. A wireless monitoring option may allow you to view "crunched" graphs of your data, which average out temperature samples taken every minute into 15 minute averages. Also, certain software and wireless data logging systems automatically calculate mean kinetic temperature, a huge factor in your sampling point decision.
9. Collect your data.
People do forget this one. Once you place your loggers throughout your mapping environment, be sure to collect all the data from all of your loggers, after your sampling interval is up.
10. Calculate mean kinetic temperature.
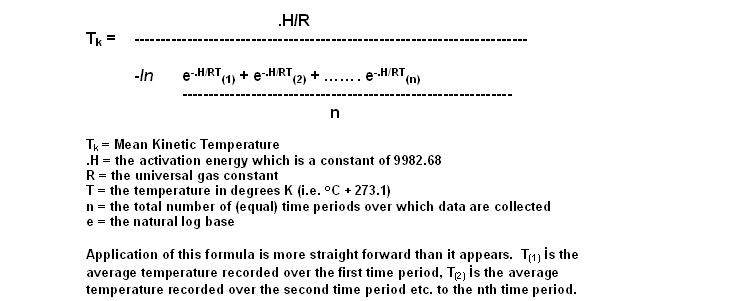
Mean kinetic temperature is crucial to temperature mapping. But what is it? Mean kinetic temperature expresses the effect of temperature fluctuations on an item during a specified time. It can be a real pain to calculate, and for those not mathematically inclined, DicksonOne (our awesome wireless monitoring system) calculates it for you!
The formula is below:
11. Re-calibrate.
You mapped your warehouse over the course of a couple of months, found all the problem spots, and have been humming along ever since. A year or so has passed, and you need to re-map your environment because you want to add another level of shelving in a couple of different areas. Make sure you re-calibrate your temperature monitoring devices before placing mapping. If it has been over 6-12 months, your instruments may no longer be accurate. Calibration is the process of ensuring the accuracy of an instrument by comparing it to a standard, predetermined to be accurate.
Think we missed something? Have an addition to make to the list? Add them in the comments below!


