Earlier this summer, on a bright but cool morning, our DicksonOne Product Manager, Matt, walked into work, tossed a Report Logger at me, and said something along the lines of, "That was in my car for three months, just now took it out." I, being a bit groggy, and still without my morning cup(s) of coffee, was unfazed. However, what he said next made my ears perk up.
"Might be useful for a blog post or something like that."
The coffee maker beeped that it had completed its important daily task. However, without ever taking a sip of that delicious brown nectar, I quickly plugged the logger into my computer and began typing away. This is what I wrote . . .
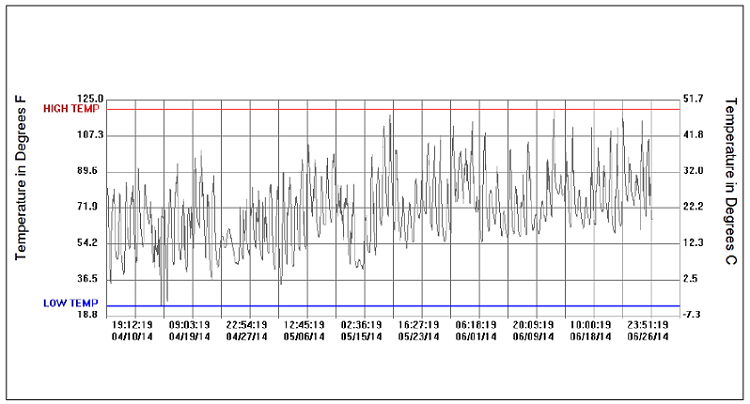
A Dickson Report Logger is good for a lot of things, one of which is ”fun data collection.” What is "fun data collection?" Collecting data, for nothing but the fun of looking at it. We did some fun data collection recently, using a Dickson Report Logger, the weather, and a car. What did we do? We tracked the temperature inside a standard sudan over the course of three months, and this is what we found . . .

That’s the graph that our Report Logger generates (no software required) of the temperature in the environment it monitors. It comes in a PDF, so while you may be having trouble viewing the intricate details of three months’ worth of data in the photo above, when I downloaded the report onto my computer, I could see everything perfectly clear.
More details: Matt set the Report Logger in the trunk of his car in early April, and took it out in late June. During those 90 days or so, temperatures fluctuated a lot. Some days temperatures would creep down to 30F in the early morning, but be at 100F by 3pm in the afternoon. The high temperature during that period was 120.2F, which came in early May. The low? 23.6F in the middle of April. So, in the span of a month, temperatures fluctuated almost 100F! I suppose we do reside in the Midwest.
A few other interesting notes: The average temperature inside Matt’s trunk was right at 70F, which is about what you would expect for a spring in America’s heartland. During the 90 day logging cycle, the logger took samples every 30 minutes, but the Report Logger does offer other customizable logging settings!
I hope you enjoyed this information as much as I did. Ciao.

