Recently FDA regulations including HACCP, various CFR code of federal regulations, and the push to eliminate wasted time and money in fixing temperature related product failures has made Temperature and Temperature/Humidity Mapping an integral aspect of any warehouse operation.
Inadequately controlled environments can lead to ineffective medicines, spoiled produce, damaged materials and frequent critical equipment failures. This all ads up to wasted dollars. Fortunately the cost of monitoring large warehouses has dropped significantly over the years as temperature and temperature/humidity sensing technology has become more accurate, easier to use and more affordable.
Whether you are concerned about maintaining a consistent temperature in a 5,000 or 500,000 sq. ft. warehouse, you’ll want to make sure that you are using the right tools for the job and that you’re using them correctly.
In this guide, we will discuss best practices for mapping temperature in large spaces.
Mapping is not a one-time job, but an ongoing process that takes into account changes in seasons, HVAC/R modifications, warehouse layout modifications and any other significant changes to the warehouse environment. Proper organization and documentation are critical in maintaining compliance and consistency.
Step 1 – Determine Critical Mapping Points
Step 2 – Determine Sample Rate
Step 3 – Establish Data Logger Criteria and Select
Step 4 – Place Data Loggers at Pre Determined Points
Step 5 – Retrieve, download and evaluate Logged Data
Step 6 - Document Processes and Repeat
Step 7 – Data Logger Maintenance and Calibrations
Step 8 – Remediation
Large open spaces present a considerable challenge when working to maintain a consistent temperature or temperature/humidity level. Problem spots include: • Areas near the ceiling or exterior walls may stay warmer or cooler in response to temperatures outside.
In addition to problem spots logger placement is also critical for the following locations:
Studies have shown that a spacing of every 100 to 300 feet in an open warehouse plan, without walls to block airflow, is adequate enough to accurately represent readings that are meaningful. A distance of greater than every 300 feet may yield data that does not accurately reflect conditions in the warehouse space, while spacing data loggers closer than every 100 feet will result in extra data that adds no value while creating extra work.
Determination of critical mapping points should include all potential problem spots in addition to the normal storage area. Be sure to space the critical mapping points in an evenly distributed grid using every 100 to 300 feet as your spacing guide.
The key to determining sample frequency is to not take too many or too few samples. Too many samples will create too much data making analysis cumbersome and difficult. Too few samples will not adequately represent changes in the warehouse environment. In most warehouses, one temperature or temperature and humidity sample every 15 minutes should adequately evaluate temperature trends.
If you think you need to take readings more frequently, consider the following:
Scenario 1
10 data loggers sampling every 15 minutes for 1week will provide 6,720 sample points.
Scenario 2
10 data loggers sampling every minute for 1 week will provide 100,800 sample points.
Scenario 1 will provide the same general results as Scenario 2 with 1/15th of the data and much less time spent analyzing logged data.
The key here is response time. Most temperature data loggers take at least a minute to respond to changes in temperature, and in a space as large as a 50,000 sq. ft. warehouse, most changes will happen very slowly over several minutes, making frequent sampling unnecessary and wasteful.
Temperature and Temperature/Humidity Data Loggers come with many features. The goal is to select the data logger that will most effectively monitor your warehouse. Key features you should consider are:
Be sure to purchase at least one data logger for each location.
Be sure to document the location of each data logger and label each data logger to ensure that it is repeatedly placed in the same location.
To ensure consistency practice the following rules:
Once the loggers have been placed and data has been collected, collect the data loggers and transfer the logged data to your PC.
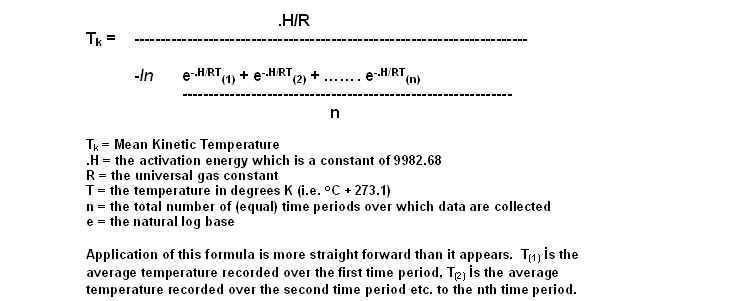
The logged data can now be exported to Excel where Mean Kinetic Temperature can be calculated.
Mean Kinetic Temperature is a calculated fixed temperature that simulates the effects of temperature variations over a period of time. It expresses the cumulative thermal stress experienced by a product at varying temperatures during storage and distribution.
The formula for Mean Kinetic Temperature is as follows:
In addition to calculating MKT it is also recommended that Min and Max temperatures should be monitored carefully and that the location and the time of day at which they occur should be recorded. Any trends should be investigated.
A free program to calculate Mean Kinetic Temperature is available at: www.stabilitysystem.com
Now that you have completed your first mapping, be sure to place the data loggers back in their original locations throughout the warehouse and make sure to document each and every step used.
Over time the most robust data loggers can drift causing inconsistencies in recorded data thus requiring regular calibration in order to ensure accurate readings.
It is recommended that each data logger be calibrated at least every 12 months. In addition, it is prudent to request before and after readings when calibrating each data logger so corrections can be made to previously logged and mapped data.
Best practice recommends sending the data logger to a NIST certified calibration facility, and to the original manufacturer for calibration whenever possible.
Now that you have your results it is time to fix any trouble spots that show up in your calculations.
Temperature mapping can be an extremely powerful tool to aid in regulatory compliance and create possible cost savings via implemented improvements and efficiencies. The key is to carefully analyze the warehouse space to ensure proper placement of data loggers, document logger locations and mapping processes, audit data including having data loggers calibrated on a regular basis and finally making the necessary changes to continuously improve warehouse conditions.