
A bit more information . . .
When discussing temperature recording devices, data resolution is a concept that is, with the demise of chart recorders, slowly dying out. It's important to consider that adverb, "slowly." While yes, data loggers are the future, and more and more the present of environmental monitoring, chart recorders still have their place, and will continue to have their place as long as those monitoring love the immediate physical readout of their data. Thus, we'd love to take this topic head on.
To fully answer the question posed in the title of this article, we need to start with another question: What is the difference between a small chart recorder, and a large chart recorder? When shopping for a chart recorder, why in the world would you pay 2X as much for an 8 inch chart recorder as you would for a small 3 inch chart recorder? There are many reasons (alarms, relays, multiple variables), and one of those reasons is data resolution. Data resolution is the amount of data you can physically view, and the precision of that data on your chart recorder. When you use an 8 inch chart recorder, you can see more of your data than a 3 inch chart recorder. How? Check out the image above:
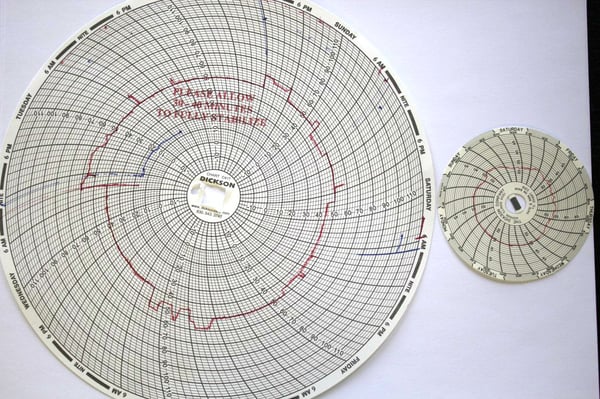
On the left, we have the temperature readings of an 8 inch chart recorder. This chart recorder measured and recorded, in Fahrenheit, the temperatures inside a warehouse over the course of 7 days. The 3 inch chart recorder, while in a different warehouse, also recorded temperatures inside a warehouse over the course of the week.
Which chart is easier to read?
Obviously, the 8 inch chart. Now what does that mean? It means you can be more accurate. It sounds silly, but the 3 inch chart (even when you are looking over it with a magnifying glass) can only really show limited temperature trends, not actual data points. You can try all you want, but if I asked you to tell me what temperature the 3 inch chart recorder warehouse was at from 12:30AM-1:00AM on Saturday, you could only say somewhere between 34-33 degrees. For some companies and applications, that is just fine. For others, specifically those audited by agencies concerned about the temperature of the materials or goods you are storing or producing, that isn't enough.
What the 8 inch chart gives you, is a greater ability to see real data points, or at the minimum, to see more detailed trends of your data. Also, as you see in the photo above, the 8 inch chart, because it is bigger, gives you the ability to monitor over a wider temperature range. That 3 inch chart is only monitoring temperatures from 25-50F. The 8 inch chart shows data from 5-115F.
Data Loggers
By bringing up data loggers, it's tough not to make everything I wrote above not obsolete. While 8 inch chart recorders are better than 3 inch chart recorders for viewing and analyzing your temperature data, they are no substitute for data loggers. Data loggers graph your data, sure. But they also provide you with actual data points, taken at specific sample intervals that you control, which is shown (usually) in some kind of tabular format. There really is no substitute.